


Forex technical analysis isn’t theory; it’s how a prop trader answers two daily questions: Where’s the trade, and how do I keep the day safe?
This guide explains what technical analysis is and its role in prop trading, why it matters in a funded environment, and how to run it inside firm rules (daily loss limits, overall/trailing drawdown, news windows).
You’ll use a tight stack—price action/S&R, a trend baseline, one momentum tool, and ATR for sizing—plus multi-timeframe alignment and a clear execution playbook built for Atmos Funded’s MT4/MT5. The promise of technical analysis in forex here is simple: fewer decisions, cleaner entries, and risk that always fits the rule set.
Key Takeaways
- Keep the stack tight: 3–5 forex technical analysis tools (price action/S&R, one trend tool, one momentum tool, ATR).
- Build the plan around risk; indicators refine, never override daily/drawdown limits.
- Only trade lower timeframes with higher-timeframe bias.
- Default baselines: 20/50/200 MAs; RSI(14) often needs pair-specific tweaks.
- Use ATR stops and ATR-sized positions; size flexes with volatility, not conviction.
- Avoid indicator overload; prefer simple, testable forex analysis techniques.
- Adjust expectations by session (Asia/London/NY).
- Atmos Funded + MT5 + real-time pricing + clear rules = disciplined execution.
Forex Technical Analysis vs. Fundamental Analysis
Answering “what is technical analysis in forex”: it studies price (structure, levels, and momentum) to frame probabilities and define invalidation (support/resistance, market structure, one momentum tool, ATR sizing).
Fundamental analysis explains why the price might move and how forceful the repricing could be (rates, inflation, jobs data, central-bank tone via calendars and policy trackers). Use FA for backdrop/volatility; use TA for entries, exits, and risk.
Comparison Chart of Technical vs. Fundamental Analysis
| Dimension | Technical Analysis (TA) | Fundamental Analysis (FA) |
| Primary inputs | Price, structure (HH/HL, LH/LL), volatility (ATR), momentum/volume proxies. | Macro data (CPI, NFP), rates/term structure, central bank guidance, geopolitics. |
| Question it answers | “Where’s the next high-probability path, and where am I wrong?” | “Why might price reprice, in what direction, and how forcefully?” |
| Time horizon & cadence | Any timeframe; intraday to swing with precise triggers. | Mostly higher-timeframe bias; punctuated by event-driven spikes. |
| Best use-cases | Entries/exits, stop/target placement, and session execution. | Bias setting, regime shifts, volatility expectations, and thematic alignment. |
| Tooling | MT4/MT5 charts, S/R, MAs, RSI/MACD, ATR sizing, alerts. | Calendars, rate trackers, yield curves, speeches/minutes, positioning. |
| Signal quality & decay | Clear invalidation; signals decay fast in chop. | Strong around surprises; can be right but early for weeks. |
| Backtesting & measurement | High rules can be coded, expectancy tracked by setup and session. | Medium, theme validation possible, but event reactions vary by regime. |
| Risk integration | Natural: ATR-based stops, fixed % risk, structural invalidation. | Indirect: widen/tighten risk around events; scenario trees vs. fixed stops. |
| Common failure modes | Overtrading chop, indicator conflict, and ignoring HTF bias. | Narrative bias, overconfidence in forecasts, trading into data blindly. |
| Handling news days | Stand aside or trade post-news structure; cut size for slippage. | Map scenarios, timing windows, and magnitude; expect gap/whipsaw risk. |
| Regime detection | ADX/trend filters, volatility bands, market structure shifts. | Policy cycles, inflation trends, growth/credit conditions. |
| Automation suitability | High for rules-based systems with clear triggers/exits. | Lower, semi-systematic (calendar gating, thresholds) works best. |
| Prop-trader fit | Excellent: precision aligns with daily/overall loss limits. | Complementary: informs bias/volatility so TA entries stay within rules. |
How Prop Traders Combine Technical And Fundamental Analysis
- Top-down bias: FA sets backdrop (e.g., hawkish Fed → USD strength); forex technical analysis times the trade (break-and-retest on EUR/USD).
- Volatility posture: Around high-impact events, FA gates risk; TA defines invalidation.
- Do-no-harm: If FA says “big day” but TA shows chop, stand down—rules win.
How To Choose Between Technical And Fundamental Analysis
- Scalp/Day: Mostly technical analysis forex with session awareness; FA = volatility switch.
- Swing/Position: Blend—FA for direction/regime, TA for precision and dynamic risk.
- Newer prop traders: Start TA-first to master risk mechanics; add FA to avoid landmines.
Why is Multiple Timeframe Analysis Considered the Professional Approach?
To keep it short, alignment. When monthly → weekly → daily → intraday point in the same direction, you filter noise and upgrade probability. It will be interesting to see how many “confusing” charts become straightforward once the stack agrees.
The workflow is simple, top-down. Define bias on higher timeframes, map structure on the middle timeframe, and only pull the trigger on the lower timeframe when it echoes the same story. Countertrend is allowed, but smaller size, modest targets, and only when the higher-timeframe looks tired.
Session context matters. London often produces cleaner breaks and retests; late New York can revert and chop. On the other hand, if the higher-timeframe trend is strong, even Asia’s quieter session can offer tidy pullbacks.
Here’s how you put it in practice with Atmos Funded. On MT5, you can pin a D1/H4/H1/M15 layout, color-code higher-timeframe levels, and set alerts so entries on the trigger chart only fire in the direction of the published bias. This top-down gating reduces false starts, helps you respect daily/overall loss limits, and keeps execution inside Atmos Funded rules without adding complexity.
When the stack agrees, execution gets boring in a good way. Fewer impulses, cleaner entries, and risks that fit inside the day’s limits. For Atmos Funded traders, this single habit quietly protects daily/overall drawdown and stabilizes results. Give it a couple of weeks; it will be interesting to see how much calmer your numbers look.
How Does Understanding Forex Markets Impact Technical Analysis?
Forex isn’t a single venue with a single mood. It’s a rolling, 24/5 auction that hands the mic from Asia to London to New York, each session with its own liquidity, noise, and follow-through.
Session dynamics: Asia, London, New York
Asia tends to range and mean-revert; breakouts often stall. London brings participation and cleaner breaks; New York extends or reverses London’s impulse around data and the cash open.
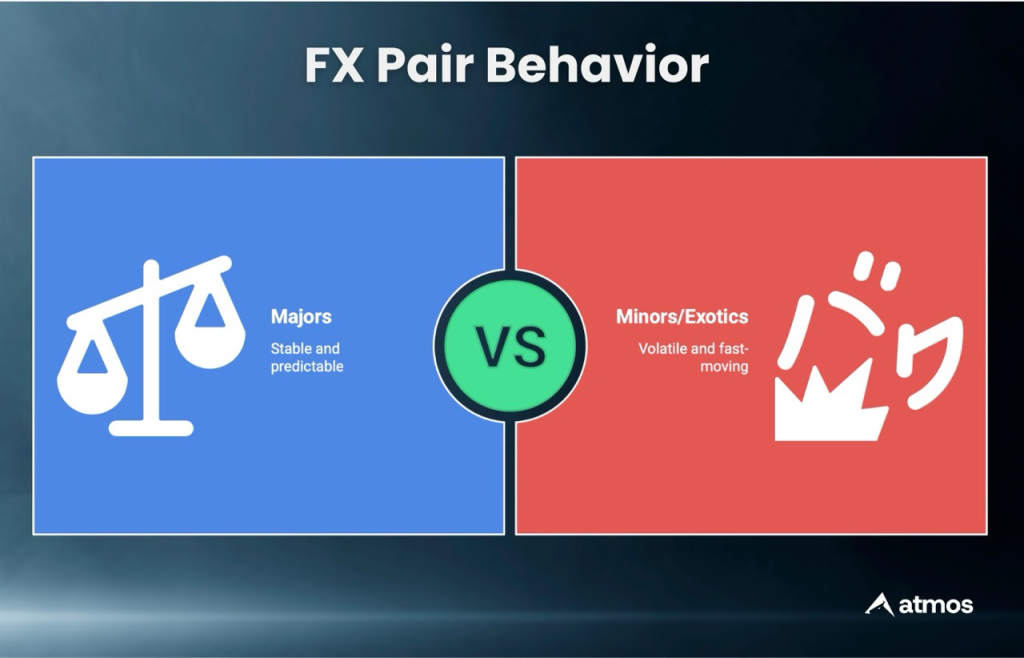
Pair personalities: majors vs. minors & exotics
Majors (EUR/USD, GBP/USD, USD/JPY) respect levels and transmit macro quickly. Minors/exotics move faster with wider spreads and more noise, demanding a smaller size and stronger confluence.
Microstructure: ECN vs. market-maker conditions
ECN-style pricing prints tight spreads and quick resolutions, great in alignment, punishing if early. Market-maker environments can “stick” at 00/50 handles; wait for the retest or a momentum close.
Policy cycles and volatility regimes
Central-bank tone, inflation, and rate expectations set the backdrop. Ahead of big decisions, ranges dominate; after surprises, trend persistence often lasts longer than feels comfortable.
Execution timing in an algo-driven tape
Algorithms compress reaction time, so patterns complete sooner and fake-outs are sharper. Anchor bias on higher timeframes, then let lower timeframes trigger only in that direction.
Prop alignment: why this shapes risk
Session and pair choice change ATR, spread, and slippage, inputs that drive stop distance and position size. Build your plan around when your setup historically behaves best, not just when you’re free.
Try This: Session, Pair, and Sizing Drills
- Mark Asia/London/New York on a demo EUR/USD chart and log ATR by session for five days; note where your setup actually follows through.
- Find three examples where a London breakout held vs. an Asia breakout failed; screenshot the retests and annotate the trigger candle.
- Record the average spread at your entry time for your primary pair; recalculate position size for three ATR scenarios using your fixed risk %.
Technical analysis works best when it speaks the language of the market you’re in, session, pair, and regime. Once those inputs set your expectations, entries, stops, and size become much simpler to execute consistently.
What are the Core Technical Indicators Every Forex Prop Trader Must Master?
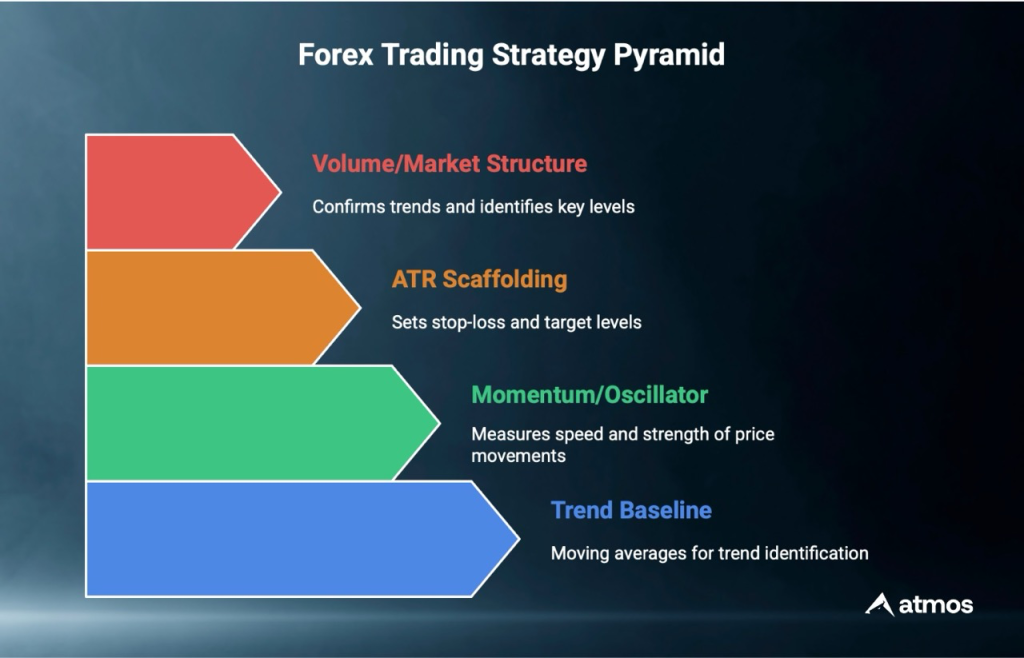
A minimal stack lowers cognitive load and avoids conflicting signals. Each tool should answer one decision: trend, timing, or risk.
- Price Action & S/R (primary layer): Plan entries/exits, define invalidation. Trade break → controlled retest or level rejection with HTF bias.
- Trend (MAs, ADX, Parabolic SAR): 20/50/200 EMA/SMA for slope; ADX(14) rising through ~20–25 = trend strength; SAR for simple trailing. If slopes flatten/ADX fades, cut size or stand down.
- Momentum (pick one): RSI(14) (tune 9–12 for fast USD pairs) or Stochastic. Use only at pre-marked levels with HTF direction.
- VWAP / Initial Balance (intraday): Fair-value and range context; fade extremes in ranges, walk bands in trends.
- ATR (volatility unit): Stops beyond structure, cross-checked at ~1.0–1.5× ATR; size = Risk$ ÷ (ATR pips × $/pip).
This minimalist forex technical analysis stack reduces conflicts and preserves the attempt budget.
Comparison of Forex Technical Analysis Tools
| Tool Name | Best For | Pros | Cons | Prop Trading Application |
| Moving Averages (20/50/200) | Directional bias, dynamic S/R, alignment | Simple, universal; trails stops; clear pullback zones | Lags turns; whipsaws in ranges | Anchor bias to slopes; trigger only with HTF alignment; cut size if flattening |
| RSI | Timing within ranges; exhaustion at levels | Adaptable; bull/bear range rules aid regime ID | Fails in strong trends; divergences persist | Use only with HTF S/R; fade when HTF neutral; downsize near news |
| MACD | Momentum confirmation; post-consolidation breaks | Histogram simplifies shifts; good multi-timeframe check | Double-lag; noisy on low TFs | Confirm break-retests; skip weak momentum in thin sessions to protect limits |
| Fibonacci | Retracement/extension mapping on clear swings | Standardized targets; great with S/R and MAs | Subjective anchors; forced fits | Draw on active impulse; partials at 127.2/161.8; avoid targets risking daily cap |
| Support / Resistance | Entries, exits, invalidation; break-retest | Non-lagging; precise stops; improves R:R | Subjective; liquidity grabs around handles | Pre-mark HTF levels; stops beyond structure; reduce size mid-range |
| ADX | Trend strength filter; regime selection | Objective strength read; rising >20 signals trend | Not directional; late on decay | Run trend systems only when rising; limit attempts sub-20 to curb overtrading |
| Bollinger Bands | Range fades; squeeze breakouts | Volatility-adaptive; highlights expansion/contraction | Many false fades in trends | Fade only in ranges; in trends, trade band walks; size conservatively on squeezes |
Execution Playbook for Forex Technical Analysis (Prop-Ready)
1) Pre-Trade (60s): D1/H4 bias set; H1 marks prior H/L, round numbers, VWAP/IB; check session fit; respect news windows; note ATR on trigger TF; set attempt budget (e.g., max 2).
2) Entry (choose one):
A) Break → Controlled Retest (close through → measured return → trigger candle with HTF direction)
B) Rejection at HTF Level (wick rejection or micro-structure shift at S/R with HTF direction)
Rule: Momentum confirms at the level; never standalone.
3) Stops & Size: Stop beyond invalidation; confirm distance with ~1.0–1.5× ATR. Size = Risk$ ÷ (ATR pips × $/pip). First partial near 1R/next structure; trail only while HTF holds. Avoid stacking the same theme; if two USD bets, halve size.
4) Daily Control: Two stops → stand down for the session. After a ≥ +1R winner, allow one extra attempt only if HTF aligns. Pre-news: stand aside or smaller-size/wider stops at structure; post-news: trade break-retest, not the spike.
How Does Risk Management Integrate with Technical Analysis?
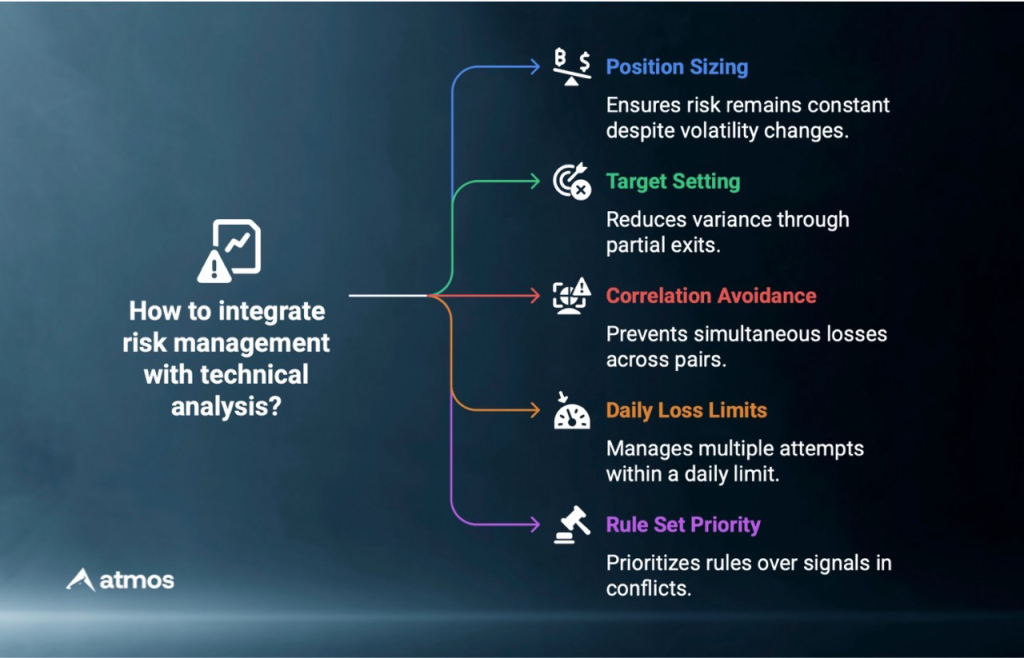
Technical analysis only works when size, stops, and targets are rule-wired.
- Sizing (ATR-based): Risk$ = Equity × Risk% → Lots = Risk$ ÷ (ATR pips × $/pip).
Example: $100k × 0.5% = $500; ATR 25 pips; $/pip $10 → 2.0 lots. - Stops: Structural invalidation first; ATR multiple second. If distance grows, shrink size, not the stop.
- Targets: First partial near 1R; trail only while HTF bias remains intact.
- Correlation theme: If two ideas share the same driver, either trade one or halve size.
What Are the Advanced Technical Analysis Techniques for Experienced Prop Traders?
Ground rule: Advanced tools earn their place by reducing decisions and staying inside prop risk limits. If they add noise, they’re out.
- Harmonics (Gartley/Bat/Butterfly): Treat PRZ as potential turn only with HTF S/R + confluence; risk by structure, not pattern faith.
- Market Profile & Order Flow: HVN/LVN for targets/retests; ignore the raid, trade the break-retest.
- Intermarket: DXY ↔ USD pairs; UST yields ↔ JPY; commodities ↔ AUD/CAD. Use to confirm FA and avoid theme stacking.
- Sentiment/Stats/AI: COT = backdrop; retail skew = contrarian hint at levels; simple regime/ATR bins pick playbook; AI labels state—execute a human-readable setup (level, trigger, stop).
Bottom line: Advanced methods sharpen context. Price action and ATR-based risk still do the heavy lifting. Keep add-ons small, visible, and explainable.
What are the Common Forex Technical Analysis Mistakes in Forex Prop Trading?
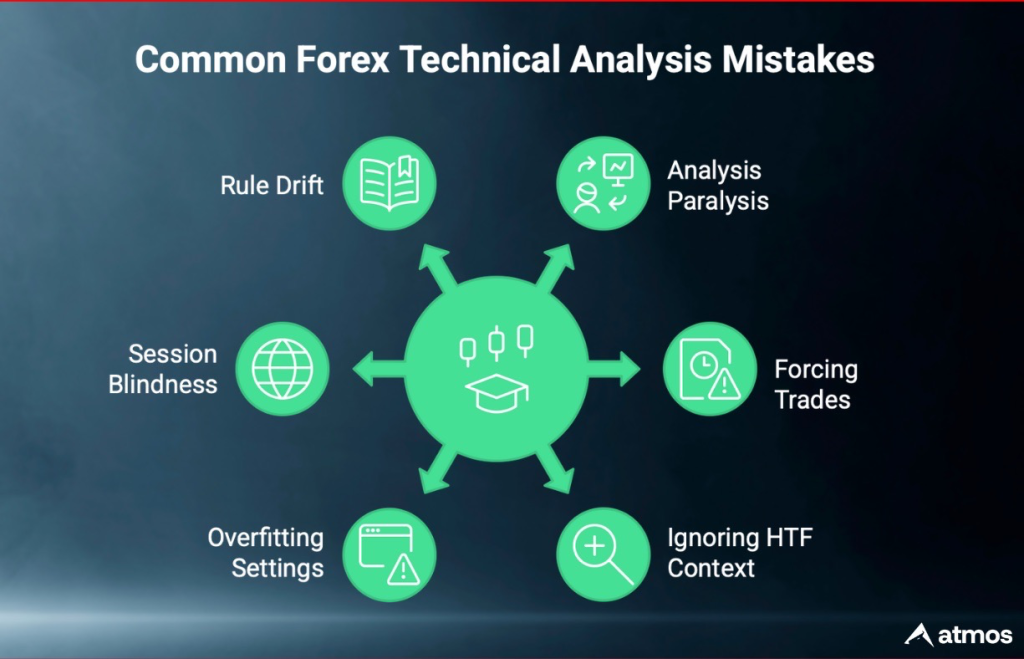
Each mistake risks breaching daily/overall limits; prevention is part of risk management.
Most failures come from process, not tools.
- Analysis Paralysis: Too many indicators; reduce to a small, role-defined stack.
- Forcing Trades: Trading during low-probability windows (illiquid Asia for breakout systems).
- Ignoring HTF Context: Taking M5 signals against a strong H4 trend.
- Overfitting Settings: Copying indicator parameters pair-to-pair without volatility checks.
- Session Blindness: Treating London and late U.S. sessions as interchangeable.
- Rule Drift: Letting bullish or bearish bias override daily loss rules.
How to Build Your Forex Technical Analysis Trading Plan?
A robust plan turns knowledge into repeatable behavior.
- Methodology: Define the core approach (trend-following or mean reversion) and the market conditions it thrives in.
- Setup Checklist: HTF bias, S/R map, signal rules, ATR stop logic, target model, and invalidation criteria.
- Journaling: Capture screenshots at entry/exit; tag conditions (trend, range, news proximity).
- Alerts: Price-at-level alerts and “retest watch” timers prevent chasing.
- Testing: Backtest and forward test in conditions similar to the intended session and pair.
- Continuous Improvement: Review weekly; remove a tool if it’s not adding decisions.
- Practical Balance: Favor clarity over perfection; the best plan is the one that gets executed under pressure.
A structured prop environment, platform access, defined limits, and biweekly rhythms support this iterative loop from test to execution.
Final Thoughts: Mastering Technical Analysis in Forex for Long-Term Prop Trading Success
The main takeaway is simple: technical forex analysis is powerful when it is pared down, context-driven, and fused to risk. Consistency, not complexity, compounds. As markets evolve, the plan evolves, but the scaffolding, multi-timeframe bias, clean levels, and disciplined sizing remain. With a systematic approach, traders build confidence one executed plan at a time.
Frequently Asked Questions (FAQs)
1. What are the most important technical indicators for forex prop trading success?
A minimal set: moving averages for trend, one oscillator (e.g., RSI) for timing, ATR for stop/target scaffolding, and price action/S&R as the foundation. Add ADX or MACD only if they clarify, not complicate decisions.
2. How do I adapt my forex technical analysis when trading different currency pairs?
Adjust indicator sensitivities to volatility (e.g., ATR multipliers, RSI periods), respect pair-specific sessions (USD/JPY during Tokyo; EUR/USD during London), and recalibrate expectations for spread and follow-through.
3. Should I focus on higher timeframes or lower timeframes for better technical analysis?
Anchor on higher timeframes for bias (D1/H4), execute on a lower timeframe (H1/M15/M5) only when it aligns. This reduces false starts and protects the daily loss limit.
4. How can I avoid false signals when using technical indicators in volatile forex markets?
Require confluence: HTF direction + S/R + a single timing signal. Around major news, either widen stops and cut size or stand aside entirely.
Appendix: Chart Basics (For Newer Traders)
Bid/Ask & Spread: Bid = sell price; Ask = buy price; Spread = Ask − Bid (tighter in London/NY, wider off-hours).
Candle Anatomy: Each candle shows open, high, low, and close. Long wicks = rejection.
Common Candles:
- Hammer: Small body, long lower wick → buyers defended lows.
- Shooting Star: Small body, long upper wick → sellers rejected highs.
Chart Types: - Line: Clean structure view.
- Bars: Compact OHLC.
- Candles (default): Fast read of intent/rejection.
Timeframes (top-down): - D1/H4: Bias & key levels.
- H1: Execution map.
- M15/M5: Triggers (only with higher-timeframe direction).
First Pass on EUR/USD (MT4/MT5):
- Mark D1/H4 swing highs/lows & round numbers (e.g., 1.0800, 1.1000).
- On H1, refine levels and set price alerts.
- On M15/M5, wait for break → controlled retest or rejection at level with HTF bias.
Place stop beyond invalidation; size using ATR so one stop can’t threaten the daily loss cap.
MT5 Tips (Atmos Funded): Save a D1/H4/H1/M15 layout, color-code HTF levels, and add calendar alerts.